You can make a sustainable meal - without moving, choping, cooking or serving!
Sustainable Food Drag and Drop
You can make a sustainable meal - without moving, choping, cooking or serving! |
|
This online exercise aims to help you:
|
|
Use your mouse to drag each of the foods you ate in your last meal and arrange around the plate. |
            
|
|
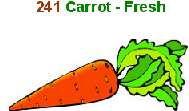
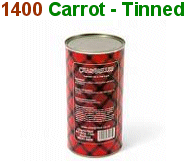
Each food image has three indicators of key elements of sustainability:
Carbon Health Water For each food graphic the carbon & water figures represent one portion. |
Add up your scores for carbon water & describe colour
Make your meal more 'sustainable', Enter the reasons for your changes in the boxes below and Discuss your choices with a friend.
| Reset
(Cntrl + F5) |
 |
Send your selection to a friend (PrtScn, Copy/Paste, Make image, Attach) |
Submit your Comments please on this "Sustainable Meal Drag n Drop" |
Email us with more food facts/figures |
"sustainable Food" for No.1 site! |
| Click For more: |
in our Sustainable Food Guide | - Climate Change |
- Nutrition issues |
- Water issues | Visit our new Carbon Counting Toolkit
|
| Copyright 2007 Environmental Practice at Work Publishing Company Ltd |